The Awstats report gives details about the amount of people coming to your site, along with other information that you will find useful. It includes things like: Countries, Visit duration, Connects to site from, Search key phrases, Search keywords, monthly, daily and hourly history, and other critical information to help you improve your web presence.
To access AWStats, login to cPanel.
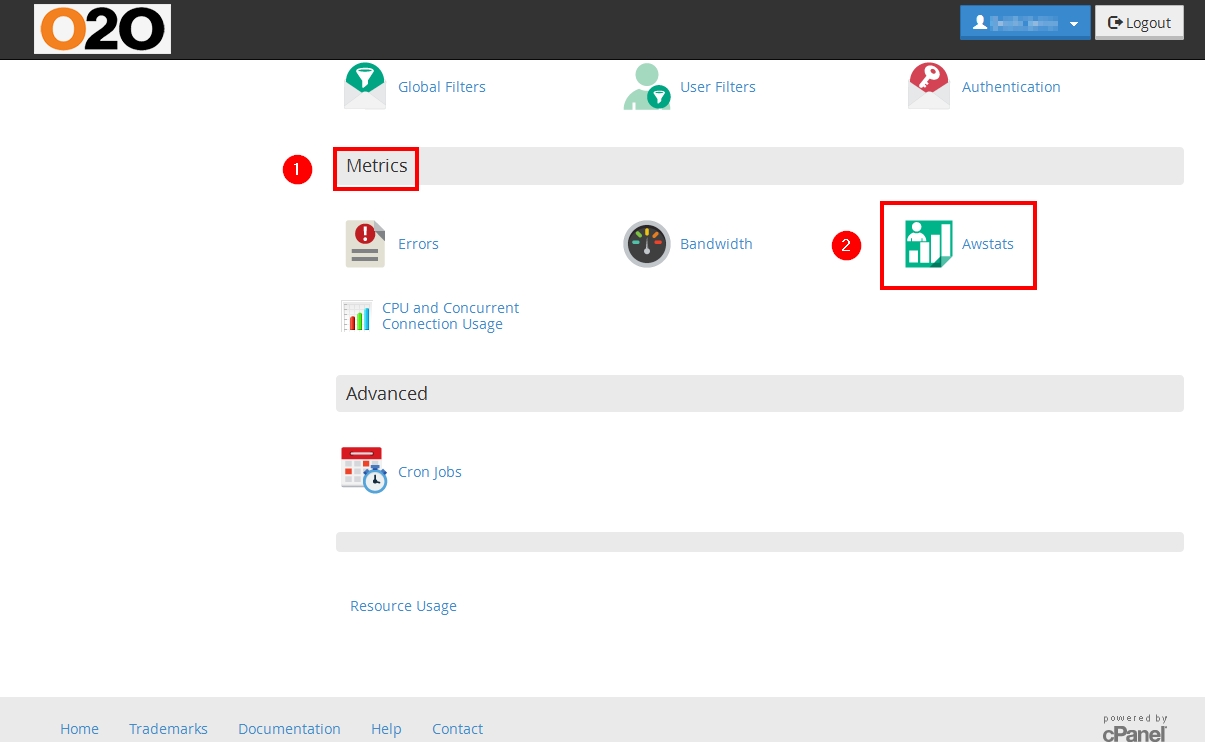
- Scroll down to Metrics
- Click on Awstats
In this article we will explain each section of Awstats and how it can be used to gain more information about your website’s visitors.
Last Update:
To the right of this label, you will see the date and hour of the last time when your statistics have been updated.
Reported period:
In this drop-down menu you can select the period you want to receive information for. If you wish to view stats for an entire year, you can select “- Year -” from the drop-down menu.
Summary
This table shows in summarized format the visits on your website for the selected period of time. The table has two rows – “Traffic viewed” and “Not viewed traffic”. Next to the “Traffic viewed” column you will see the visits registered from regular viewers. Those numbers can be associated with real people. On the other hand, next to “Not viewed traffic” you will see the visits to your pages that include search robots, crawl bots or replies with special HTTP status codes (i.e. pages that were not found, etc).
Unique visitors
Under this column you will see the number of unique IP addresses that have accessed your website. This number can be associated with the different people that have browsed your website.
Number of visits
This column shows the total number of visits to your website. If a certain person reads your pages every day he/she will add to this number on each visit. Right under it, you will notice the visits/visitors ratio. It can be useful to determine how many of your users are returning to your website.
Pages
This field shows the number of different pages that were opened on your website from your visitors.
Hits
Under this label you will see the number of accessed files that were recorded for your pages. For example, if your index.php file includes four other documents, when the index file is accessed, it will generate a total of 5 hits.
Bandwidth
Each file of your website has a certain size. For example, if your index.html file is 100KB, each access to your website will generate 100KB of bandwidth. The size of all files downloaded from your website is added to this number. Below it, you can find the Bandwidth/Visit. It provides you with information on how much data each visitor downloads on average.
When
Under this table you can find the same information displayed per different time frame. The “Monthly history”, “Days of month”, “Days of week” and “Hours” categories provide you with useful information of when your website has been accessed the most. Those tables include the same fields explained above.
Countries (Top 25)
Next to this label, you will see a list of the 25 countries from which your website has been accessed the most. You can click on the “Full list” link in order to check all the countries that you have visitors from.
Hosts (Top 25)
In this part of the Awstats tool you will see a table of hostnames or IP addresses that have accessed your website. If you recognize an extensive number of visits from a certain IP address or a network, you can block the access to your website from it to prevent a possible DoS attack against your site.
Authenticated users (Top 10)
This statistic shows the number of visitors that have accessed your (if any) password protected directories.
Robots/Spiders visitors (Top 25)
As you probably know, search engines use bots to index websites on the Internet. Those visits to your website are recorded and shown in this category.
Visits duration
This statistic shows the average amount of time that your visitors have spent on your website.
Files type
Shows a list of the most accessed file types on your website.
Pages-URL (Top 25)
This shows the pages in your account that were accessed by your visitors. This statistic provides you with useful information about which part of your website is most viewed.
Operating Systems (Top 10)
In this field you will see the operating systems that your website has been accessed from.
Browsers (Top 10)
Shows a list of the browsers that were used to access your pages.
Connect to site from
If your website has been reached from a link in another page, this URL will be recorded here. From this part of the statistics you can receive useful information which sites refer most users to your site.
Search Keyphrases and Search Keywords
Here you can find the list of keywords and keyphrases that you have set in your pages and check the way they have been scanned by the stats engine.
HTTP Error codes
A list of the HTTP error messages that your visitors have received. For example, if someone browses to a non-existent page in your site, it will add to this number.
To help understand the AWStats page, go to
http://awstats.sourceforge.net/docs/awstats_glossary.html
You will find a complete listing of all the terms and gain a better understanding of what the AWStats are telling you.
